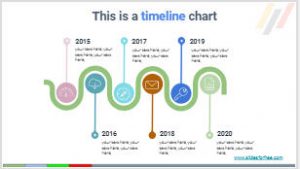
Infographics are a great way to present data in a presentation and capture the attention of your audience. In this presentation you will find 10 timeline infographic charts, completely for free! to power your presentations. You can move any element, change color, shape, adjust sizes, and input your text.
 You can use these modern timeline charts templates in PowerPoint, Google Slides themes or Keynote presentations. This free resource contains 10 different timeline charts. To use them you only have to copy to your Google Slides account or download it in pptx format, and copy paste in your own presentation.
Free timeline infographics charts features:
- Presentation with 10 slides, each of them containning a different graphic
- Fully editable charts. You can add text, change color, size, etc.
- Awesome design
- Especially recommended for light color presentations
- Ratio 16/9. You can change to 4/3, but some graphics and icons may lose the proportion.
- You can download it as a PowerPoin template, use it as Google Slides theme and once you finish editing the presentation you can export to JPG, PDF, JPG, PPT, etc from the “Archive menu” in Google Slides.


Deja una respuesta